WARNING. This is going to be a bit of a technical post, reader beware!
A lot of different people have made lots of claims about how new voting systems such as approval voting, instant runoff voting, and score voting can improve the American electoral experience. But is that really the case? Exactly how much can things improve?
Well to see how much these things matter, I wrote a Python election simulator. Like all models, this model is wrong, but maybe it also might be useful.
Assumptions
Here are some assumptions going in to the latest iteration:
- A “spatial”, Nth-dimensional preference voter model, where people’s preferences can be thought of as points in space. Just think of the typical political spectrum, and you can add even more or less dimensions to it.
- All the voters will vote “honestly”, in that their favorite candidate will get the best scores or ranks, and their most hated candidate will get the lowest scores or ranks. All candidates are rated proportionate to their dislike.
- There is a “tolerance circle” of dislike, where at a certain preference distance, any candidate outside of the circle is unranked, scored zero, and unmarked.
- The voter preference distribution for a faction is Gaussian, but there are multiple factions for each voter population
- If a tie occurs, a winner is randomly chosen.
- There are a bunch of parameters for the model, and each parameter is varied by a Gaussian distribution. Parameters include:
- Voter error — For each candidate rating for each voter, error is randomly introduced.
- Number of factions — For each election we can decide how many factions there are. Faction centroids are also set with a Gaussian distribution.
- Faction width — For each faction, the standard preference width is set to determine how wide the faction’s distribution is.
- Number of preference dimensions — More and more voter preference dimensions can be added.
Measuring Performance
There is no one agreed upon metric of performance, but various folks have tried to come up with lots of different measurements. For this blog post, I’m going to stick with something called “Voter Satisfaction Index”.
In this metric, basically I calculate the preference distance of every voter away from all the candidates. Then I calculate the following:
- The candidate with the shortest distance is called the “ideal winner utility”.
- The average distance of voters away from all candidates is called the “random winner utility”.
- We use the ideal and random utility to scale the utility of the actual winner in order to convert these distances into a percentage.
What voting systems are tested?
I tried to get a good sample of the “latest and greatest” single winner systems, which are:
- Instant runoff voting (irv) — the most popular ranked system in America and the world
- Range (score) voting (rrv) — A “cardinal” voting system where you rate/score candidates from 0 to 5 like you do an Amazon review.
- Smith Minimax — A ranked variety of “condorcet” voter systems, where every candidate is put head-to-head against each other.
- STAR voting (star) — A popular variant of range voting.
- Approval voting — Another popular binary variant of range voting. For our simulation, we assumed that approval is the same as range except the score is rounded to a binary result.
- Top-Two-Runoff (ttr) — A widely used voting system employed in many city governments, for example Houston. In our model, we assume that all general election voters will also vote in the runoff, which is usually never the case. So our simulation assumes the best case top-two results.
- Plurality — Our favorite American system used in presidential and congressional elections. The candidate with the most votes wins.
What’s the Result?
There’s an infinite combination of parameters we can test, but I’m going to limit our cases to some arbitrarily selected parameters described above. From our preliminary analysis, it seems as the most important variables are the number of factions, the number of candidates and the number of preference dimensions. The greater the number of factions & candidates over the number of dimensions, the worse and worse plurality & top-two-runoff perform.
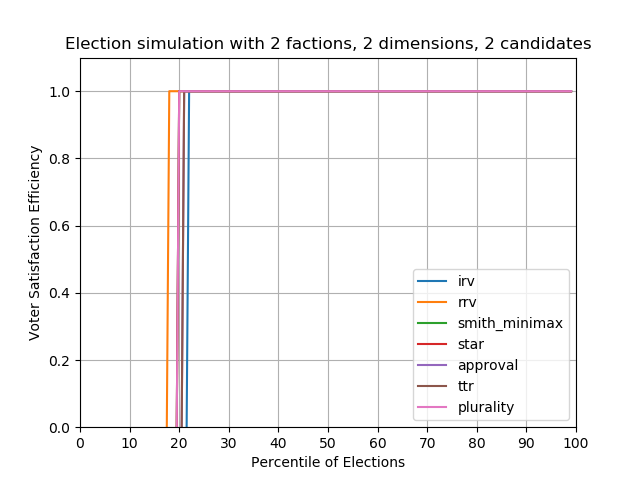
Case #1 — 2 factions, 2 Candidates
The plots below show our metric, voter satisfaction efficiency (VSE), plotted against the Nth percentile of elections out of 1000 elections. For example the 10th percentile plots the 10% worst possible VSE results for those 1000 elections, whereas the 90th percentile shows the 10% best possible VSE results for 1000 elections.
When there are only two candidates to choose from, basically all the methods perform the similarly (Actually IRV seems to perform a bit worse than others, and scored voting somehow performs best). For these simulations, 80% of the time the utility winner – the winner that maximally satisfies all voters – is elected, and 20% someone else is elected.
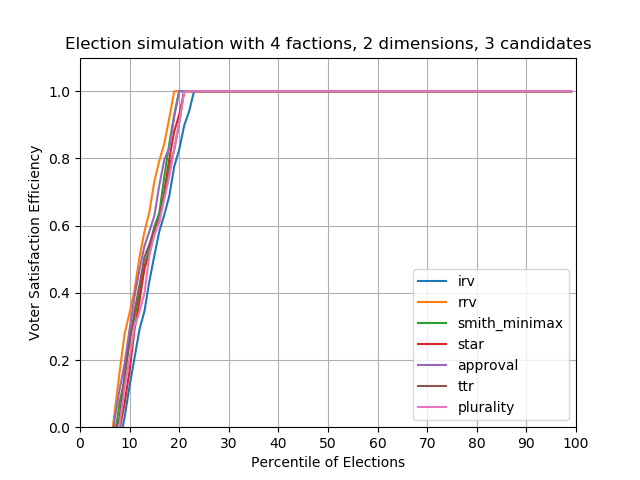
Case #2 — 3 candidates
With 3 candidates randomly placed on the political spectrum, no method seems to do particularly better than the other. Beware that this simulator places candidates randomly! In the real world, parties and factions will never randomly choose candidates.
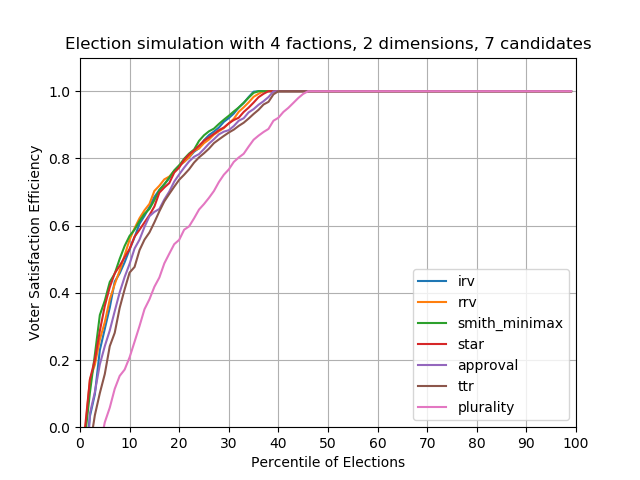
Case #3 — 7 candidates
As we increase the candidate count, plurality starts to perform worse and worse, and becomes more susceptible to clones and vote splitting. In this plot, basically 45% of plurality elections fail to elect the better winner compared to other methods. In contrast, all the other methods — IRV, Condorcet, scored/ranged, even top-two-runoff, have similar performance. For 55% of elections (from 45th-100th percentile), all election methods elect the same candidate.
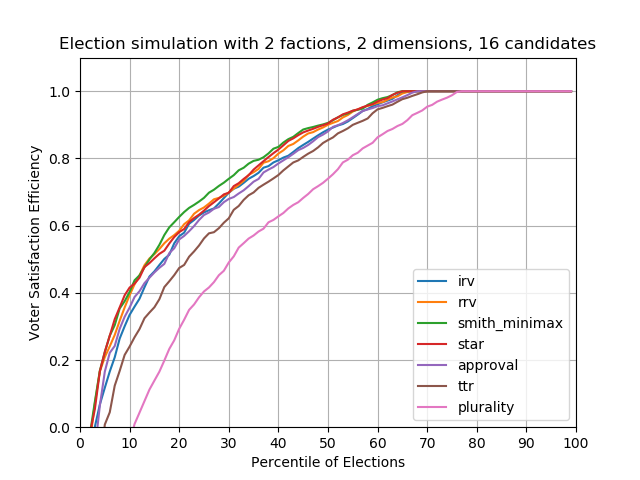
Case #4 — 2 factions, 16 candidates
With even more candidates, top-two runoff performance starts to lag behind the others. Plurality voting also fails even earlier, with about 75% of plurality elections performing worse than all other methods.
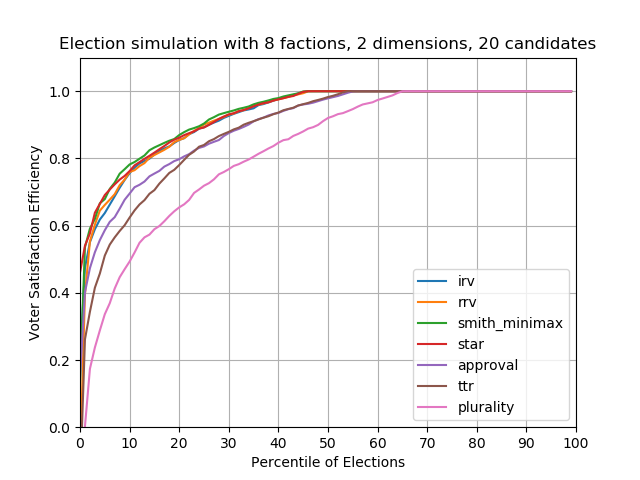
Case #5 — 8 factions, 20 candidates
You might be thinking, “20 candidates is crazy and unrealistic!” I’d disagree. I think most elections have this many candidates, but they’re also oftentimes forced to drop out, or they’re filtered out through the primary system, or they’re filtered out due to lack of funds. Anyways in my opinion in an ideal world, we’d want as many candidates, and therefore as much choice, as possible. And therefore we’d want some sort of system that can handle lots of candidates.
What we do know for certain, is that plurality voting performs terribly with increasing candidates and increasing factions, whereas other voting systems are resilient.
It comes as a personal surprise to me that in these scenarios, IRV, range, Condorcet, and STAR all perform very well. For this scenario approval and top-two-runoff lag behind, and plurality performs the worst. In other words for about 50% of elections approval and top-two perform worse than the others, and for 65% of elections plurality performs the worst.
Conclusions
What exactly does all this mumbo jumbo prove? Well, it proves that IRV, score, and Condorcet are pretty good for all tested scenarios, and it proves that plurality elections perform the worst across the board.
The analysis also suggests that approval and top-two-runoff might have performance issues in certain scenarios.
This analysis is limited in that organized voter strategy is not simulated. However, I’d argue that party/factional strategy is somewhat simulated, particularly how conspiracies can place candidates in order to vote split. This analysis shows that plurality voting is the most susceptible to these conspiracies.
Unfortunately this analysis is not comprehensive and is performed using my limited free time. Thanks for reading!
— John Huang